


Patsnap Releases 2023 Global Innovation Report: The Brilliant Names to the Dynamic Landscape of Innovation
Technological innovation is advancing at an ever-increasing pace. Over the past decade, global research and development (R&D) spending, a pivotal driver of technological innovation, has grown from 2.00% of GDP to 2.63%. After over a century of combined effort, 100 million patents were filed as of 2017, serving as the legal proof of technological innovation. This number is expected to double within the next ten years. While the realm of innovation encompasses a wide array of individuals, organizations, and institutions, it is undeniable that a significant portion of groundbreaking innovations can be attributed to a select group of tech companies.
Patsnap releases our very first Global Innovation Report, to identify and celebrate these innovation frontrunners, built on our proprietary “Innovation Capability Evaluation Model”. We identify and celebrate both the world’s top innovators, the Global Innovation 100, who have consistently pushed the boundaries of technology, and the rising Global Disruption 50, young companies who have developed remarkable technology capabilities, bringing disruptive change to the world. These global innovators and disruptors together represent the dynamic landscape of innovation, shaping the future of technology across a diverse array of industries.
Beyond the identification of these companies, we also illustrate some insights into the essence of their innovation. The Global Innovation 100 and Global Disruption 50 are not just 150 individual companies, each of them represents a small innovation ecosystem as there can be hundreds of subsidiaries within each organization. Together they represent the dynamic landscape of innovation, shaping the future of technology across a diverse array of industries.
Jump to…
Who are the 2023 Global Innovation 100?
Who are the 2023 Global Disruption 50?
Innovation is Deeply Interconnected
Who are the 2023 Global Innovation 100?
The Global Innovation 100 are the greatest innovators of this era. Over the years, they have led the world’s technology progress, and consistently outperform others in technology innovation. They are also trailblazers in the innovation ecosystem. They exert a profound influence on companies both within and beyond their respective industries, propelling the advancement of our times.
In the 2023 list, the 100 tech giants demonstrate distinctive capability in all the four technology dimensions. They have a huge technology size with outstanding technology quality, radiating profound technology influence, and a high degree of technology globalization.
Each company also has its own technology characteristics. For example, Samsung Electronics has the largest technology size, who filed a total of 884K patents. Johnson & Johnson outperforms all the others in terms of technology influence, whose patents are totally cited at 6.6M times high. In terms of technology globalization, Huawei has 64K PCT patent filings, and Pfizer’s patents cover a staggering 138 countries and regions – both are top among the 100 companies.

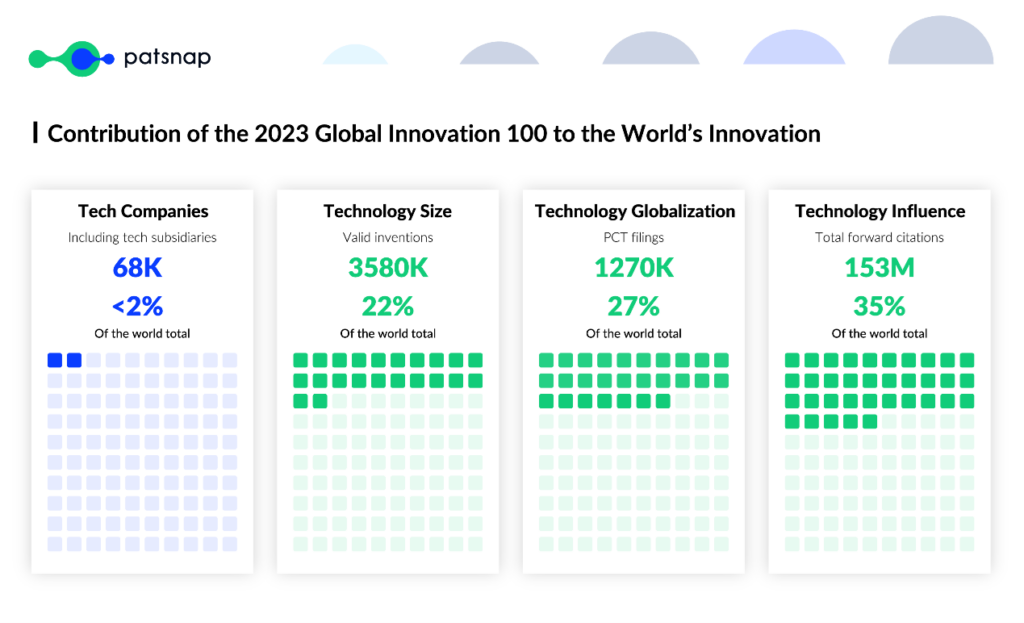
The Global Innovation 100 contribute to a quarter of the World’s technology innovation. Together, they are holding 3.58M valid inventions, which accounts for 22% of the world’s total technology assets. While in terms of technology globalization, they totally filed 1.27M PCT patents, indicating a 27% presence in the international technology competition. Most important of all, their patents are cited 153M total times, contributing to as much as 35% of the world’s technology inspiration. Despite these impressive innovation numbers, these 100 companies, alongside with their 68K tech subsidiaries, they account for less than 2% of the world’s total number of tech companies.
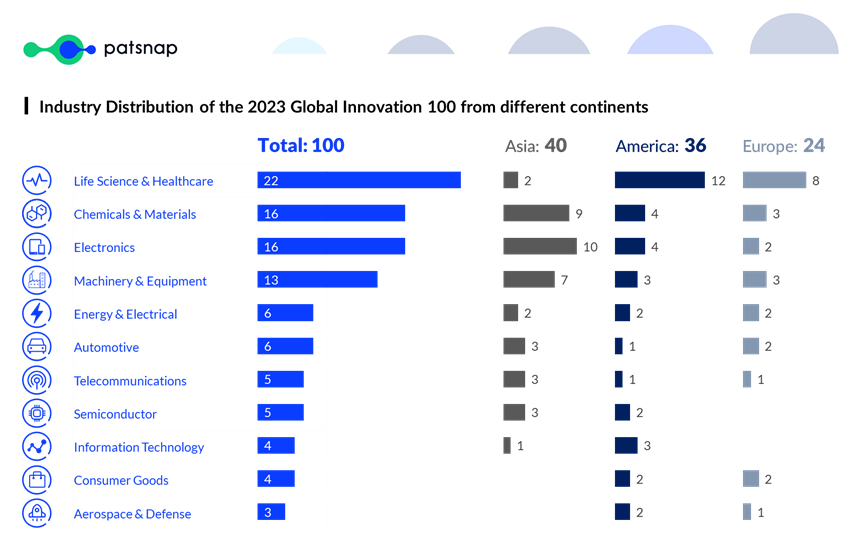
The Global Innovation 100 come from a variety of regions and industries. These top innovators come from 11 industries, 70% of them falling in Life Science & Healthcare, Chemicals & Materials, Electronics and Machinery & Equipment. Among them, Asian companies has a higher percentage in Chemical & Materials, Electronics and Machinery & Equipment, while their American and European counterparts have particularly strong presence in Life Science & Healthcare. In terms of geographical distribution, they come from 15 countries/regions. But in terms of patent applications, their technology footprints spread over the world.
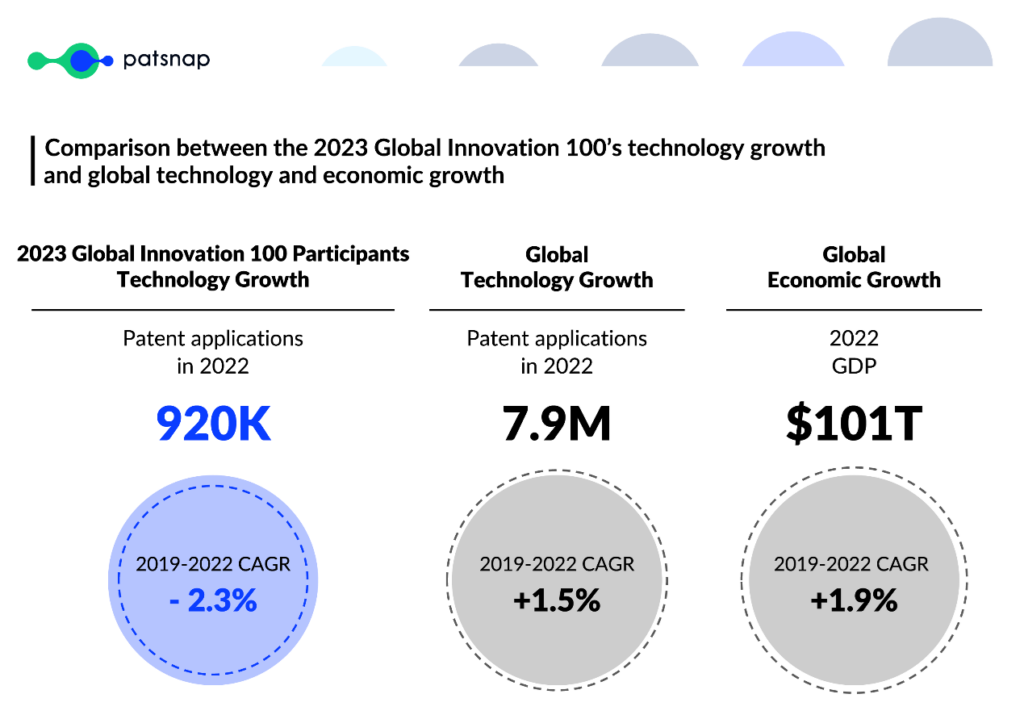
Although showing signs of a slowing pace of innovation, the Global Innovation 100 are taking active steps to develop cutting-edge technologies. They have an average technology growth rate of -2.3% over recent years, slightly lower than overall global technology growth and economic growth. Only one in five of the 100 companies listed has maintained positive growth. But they are also gaining strong growth on some cutting-edge fields, such as smart grids and biomedical engineering. These “high-growth” tech subsidiaries are mainly concentrated in Asia and the U.S.. Both in-house incubation and external acquisition are used to build their portfolios.
Who are the 2023 Global Disruption 50?
The Global Disruption 50 are highly ambitious companies that demonstrate disruptive innovation capabilities and keep growing fast. They often lead to awe-inspiring breakthroughs and bring about disruptive changes in the established world, inspiring new possibilities. They have the potential to become future Global Innovation 100 members. We use our proprietary Model to select those top performers, with important restrictions of being “young” and “active”.
In the 2023 list, we see those young pursuers demonstrate vigorous ambition and significant progress. Founded between 2009-2019, these organizations have built up an astonishing technology competitiveness in less than 15 years. They also exhibit a high growth rate with an average patent application CAGR of 51%.
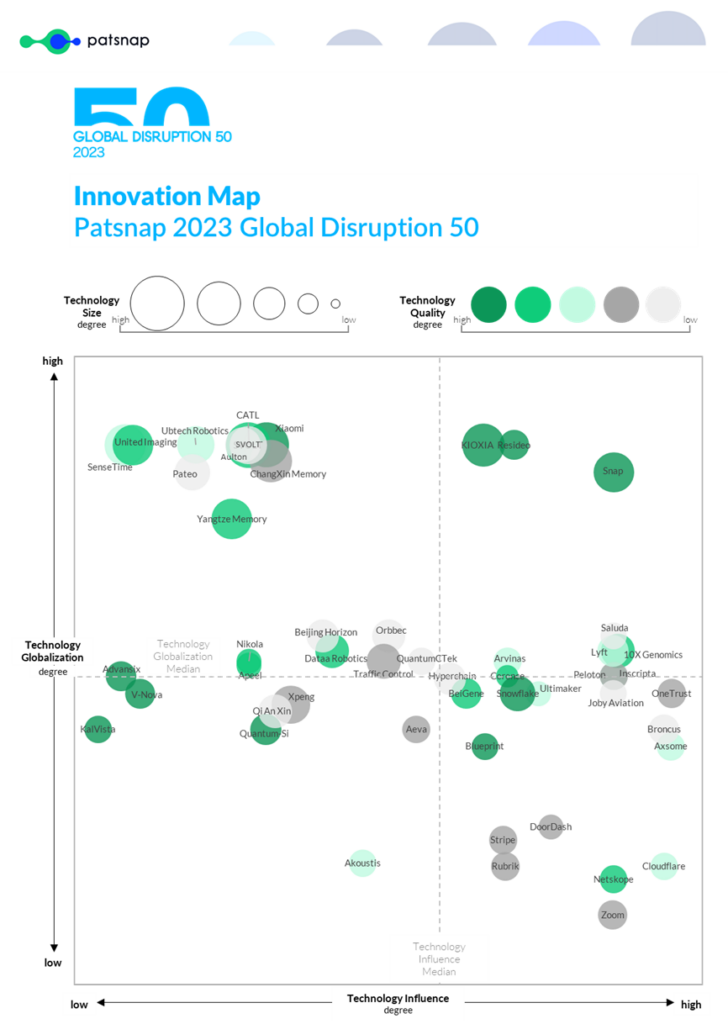
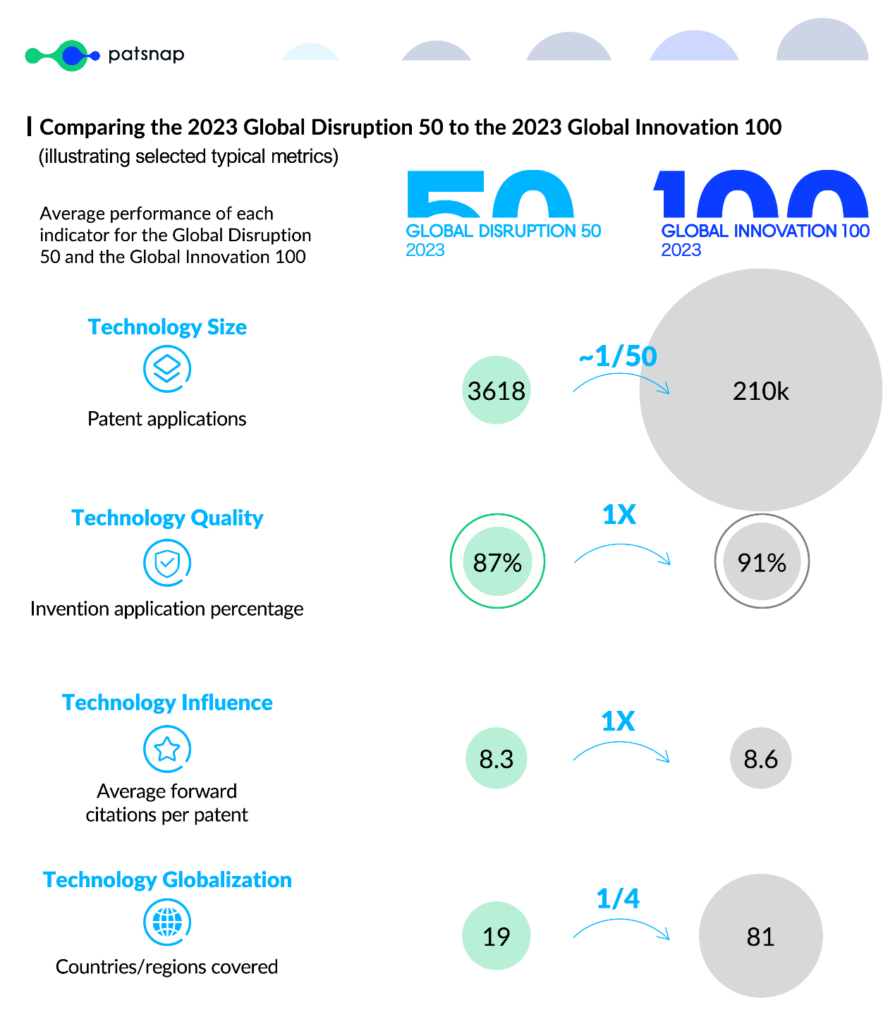
Despite their relatively modest size and limited global coverage, these organizations are already showcasing a potent technological influence. A typical Disruption 50 company has only about 3600 patent applications, 2% of the size of an Innovation 100 company. They are also far less globalized, since their technologies only touch averagely 19 countries or regions, merely 1/4 of the average of Innovation 100. However, each of its patents receive 8.3 citations, almost equal to that of a Global Innovation 100 company. Top technology influencers include Snap, Kioxia, Cerence, Stripe etc., whose top 10 cited patents are cited 300-600 times on the average.
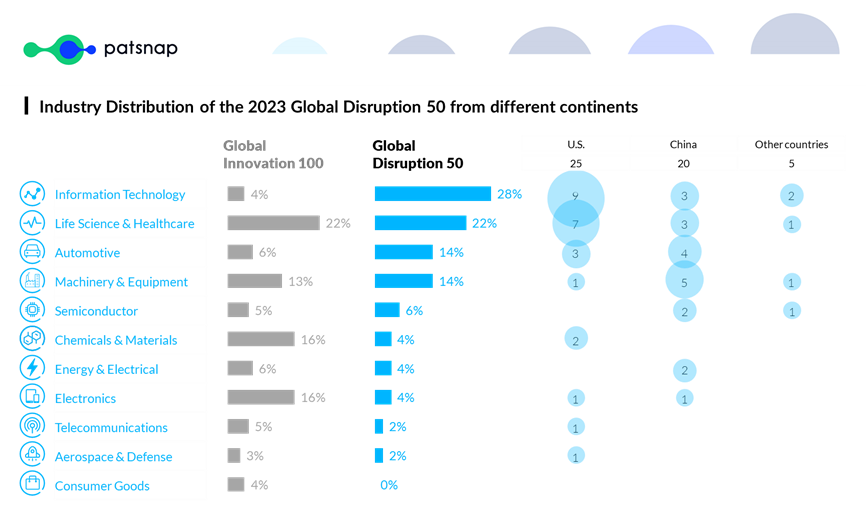
The Global Disruption 50 companies mostly come from the U.S. and China. The U.S. maintains a dominant position, accounting for half of the list. And most of them are focusing on Information Technology and Life Science & Healthcare. China is rapidly advancing with 20 companies, particularly in High-Tech Manufacturing, a strong contrast to its relatively weak presence in Global Innovation 100. Other 5 companies come from Japan, Australia, U.K., Ireland and Netherlands, one in each country.
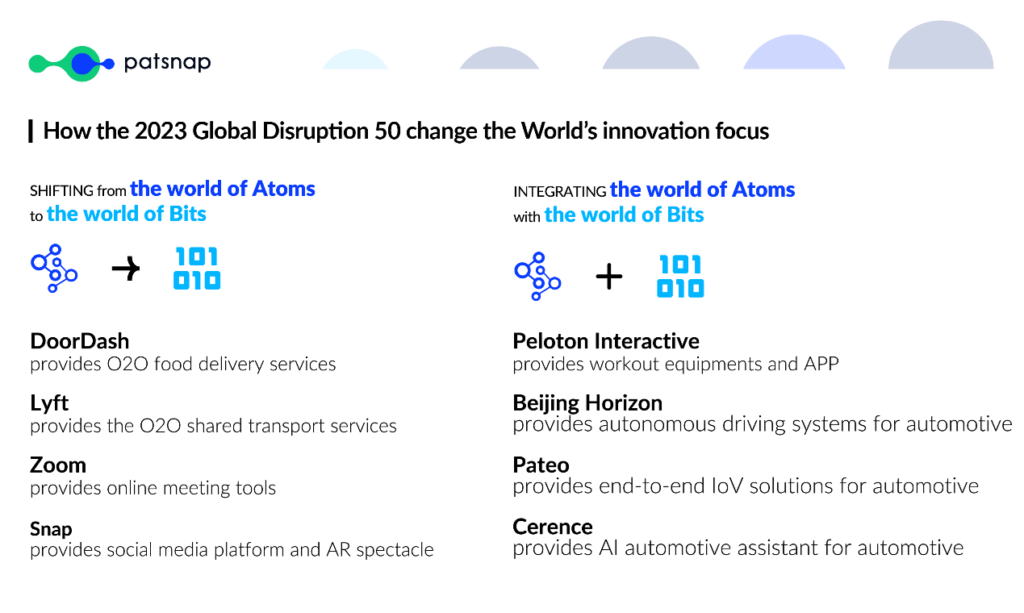
From the Global Innovation 100 to the Global Disruption 50, the world’s innovation is shifting from a physical “world of Atoms”, to a digital “world of Bits”, and even a “world of Atoms empowered by Bits”. Nearly 30% of the Global Disruption 50 companies are from the IT domain. While DoorDash provides online food delivery services in the U.S., Lyft provides online shared transport services. And Zoom is reinventing the conventional teleconference with revolutionary online tools. Many participants from other industries are also offering solutions integrating physical products and digital services. For example, Peloton Interactive is a game-changer in the fitness sector providing workout equipment as well as software and platforms. Pateo is the end-to-end solution provider for the Internet of vehicles from automotive electronics and software to operating systems.
Innovation is Deeply Interconnected
The abundant tech data behind the Global Innovation 100 and Global Disruption 50 also sheds light on the overall landscape of innovation. We can clearly see that innovation is deeply interconnected.
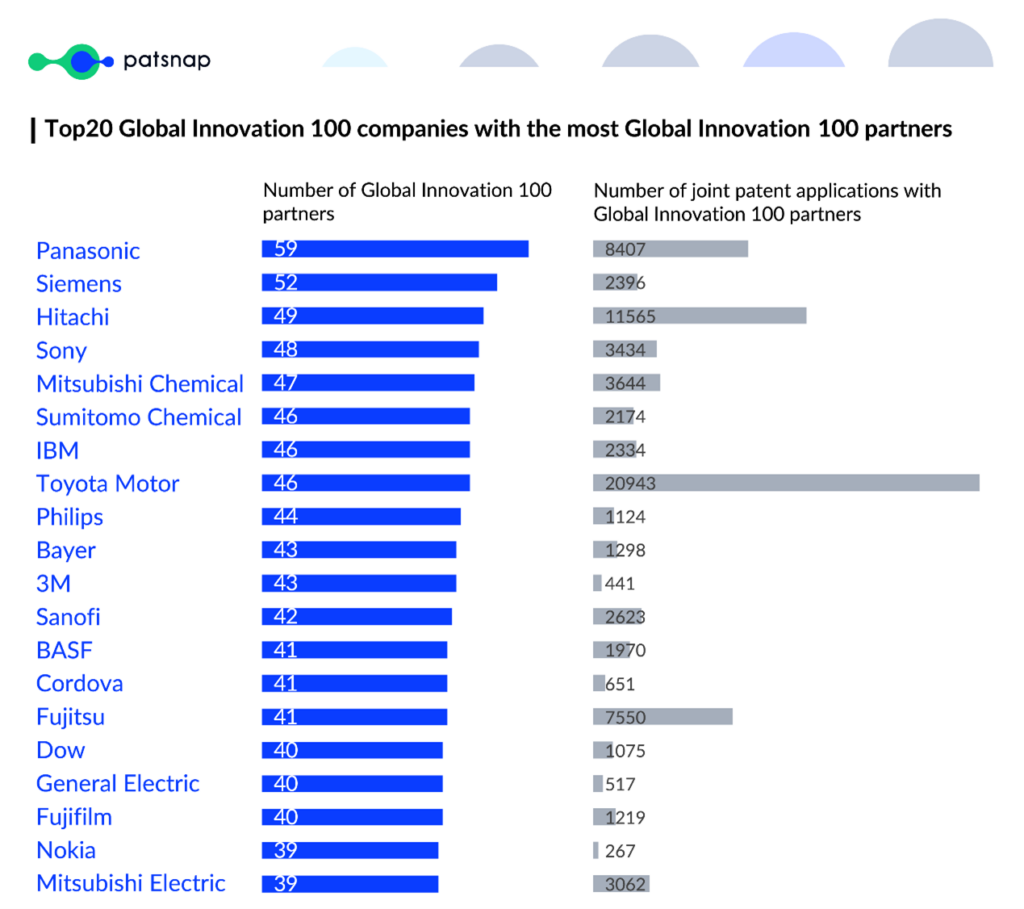
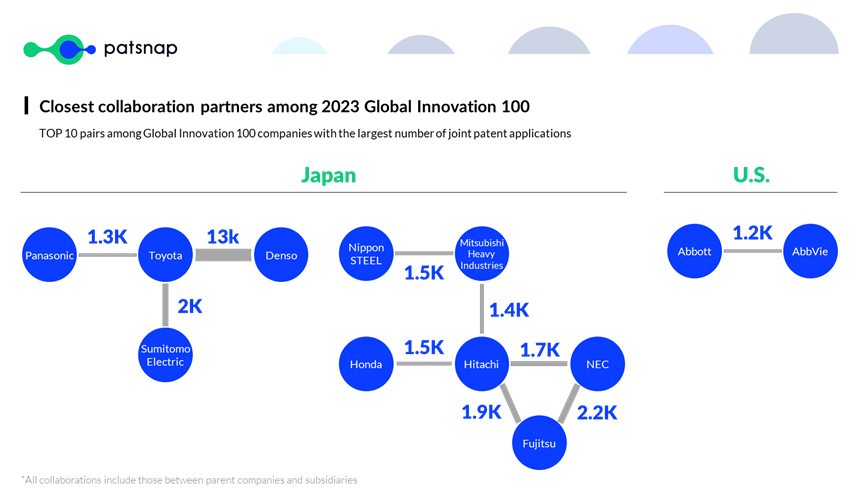
Innovation collaboration is Ubiquitous. The Global Innovation 100 collaborate closely with each other in R&D. 99 out of the Global Innovation 100 participants have collaborated on technology innovation with others from the list. And each global innovative leader has averagely 26 partners in the list. Jointly, they have filed a staggering 85K patents. Those with the most partners are Panasonic, Siemens and Hitachi, each with around 50 partners. While those with the most joint patent applications are Toyota, Denso and Hitachi, each with more than 10K joint patent applications.
Interestingly, these tech giants also demonstrate different collaboration preferences. The U.S.’s 36 companies among Global Innovation 100 are more inclined to file joint patent applications with their overseas counterparts. Their joint patent applications with domestic counterparts are 40% of that with overseas counterparts. By contrast, the Japanese ones prefer cooperating with domestic counterparts, their joint patent applications with domestic counterparts being 6 times that of overseas ones. When we take a closer look at the top 10 technology partners of Global Innovation 100, 9 pairs out of 10 are from Japan. The top pair are Toyota and Denso. Denso, as a former subsidiary of Toyota, continues to technologically cooperate with Toyota after its spinoff. The 2 companies have jointly filed as many as 13K patent applications with each other. Additionally, Toyota Motor and Sumitomo Electric have more than 2K joint patent applications, and so do NEC and Fujitsu. Only 1 pair is from the U.S, namely, Abbott and AbbVie, who have jointly filed 1.2K patent applications.
The Global Disruption 50 participants also have strong relationship with the Global Innovation 100. 5 out of the 50 companies are spinoff from other well-established tech giants, some of which are even among the Innovation 100. For example, Resideo and Advansix are both spin-offs from Honeywell, one of the 2023 Global Innovation 100 companies. Kioxia, the Japanese semiconductor leader, inherited the core semiconductor technology of nearly 20K patents from its former parent company Toshiba, who is also one of this year’s Global Innovation 100. With the “legacies” they have inherited from their former owners, these companies have obtained unique technology advantages from day one, and they continue to make technology breakthroughs.
Methodology Behind the Report
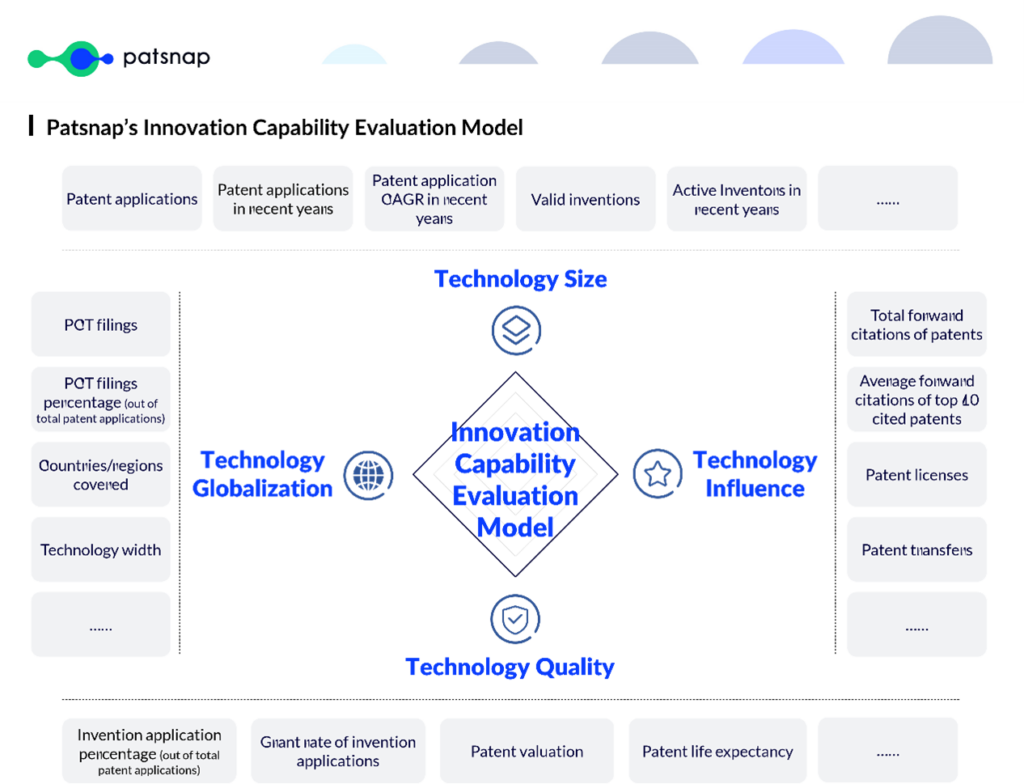
Patsnap’s annual Global innovation report is constructed based on Company Innovation Capability Evaluation Model. The model includes 1+4 dimensions, namely, 1 enterprise competitiveness dimension and 4 technology dimensions, i.e., Technology Size, Technology Quality, Technology Influence and Technology globalization. Integrating all the 40+ indicators up, each tech company has a final score of innovation capability.
Based on the model, we keep evaluating innovation capability of the ~100 million tech companies all over the world, as well as their comprehensive innovation metrics, with a complex calculation of the ~180 million patents behind them.
In the report, we use the model to select the top performers as this year’s “Global Innovation 100”. And for “Global Disruption 50”, we keep the top performance as the core criteria, while adding 2 restrictive conditions of being “young” and “active”: they should be less than 15 years since founding, and their patent growth in past 3 years should have an annual growth rate of at least 10%.
It should be noted that all the companies listed are independent, not subsidiaries of any other company.
Enhance your understanding of global innovation by delving into the full report.
Your recommended content
-
All Charged Up: Power Batteries & The Patent Race Shaping the Future of Electric Mobility
Category: Article | Category: battery technology | Category: electric vehicle | Category: EV | Category: lithium ion | Category: lithium ion battery | Category: NEV | Category: new energy vehicles
Monday, April 22, 2024
In the ever-evolving landscape of innovation, the electric vehicle (EV) industry stands as a beacon of technological transformation. As we explore the patents propelling the EV revolution, Apple's venture serves as a poignant example of the challenges even industry giants face in this competitive arena. Join us on a journey through the global patent landscape, where the quest for superior power solutions unfolds, and where the true pioneers of the EV revolution are making their mark.
-

The People vs. AI: Who Owns Ideas in the Era of Generative Artificial Intelligence?
Category: AI era | Category: AI-driven creativity | Category: AI-generated creations | Category: Article | Category: copyright and patent rights | Category: digital innovation | Category: innovation | Category: intellectual property law | Category: legal implications | Category: OpenAI Sora | Category: patent law | Category: Research Tag | Category: Sora | Category: text-to-video generative AI | Category: who owns AI
Monday, April 22, 2024
OpenAI’s Sora software, a text-to-video generative AI model, recently made headlines showing a series of 1-paragraph prompts and some high-quality footage generated based on those prompts. It is a rightfully impressive showing, but it’s still too early to identify how IP law will be disrupted by generative AI. This editorial delves into the multifaceted landscape of Sora's impact, offering insights into the future of innovation and ownership in the AI era.
-

Patsnap’s 2023 Disruption 50: A Closer Look at Tomorrow’s Innovators
Category: Article | Category: eBook | Category: Research Tag | Category: Whitepaper
Wednesday, November 15, 2023
Through active growth, the Global Disruption 50 have quickly established solid technology quality and profound technology influence that are comparable to that of the Global Innovation 100.