


The Origins of Patsnap’s 2023 Global Innovation 100
This year, Patsnap is excited to release its inaugural Global Innovation Report for 2023, featuring two distinctive lists: the Global Innovation 100 and the Global Disruption 50. In this article, we explore the origins and characteristics of the Global Innovation 100, shedding light on the regions, industries, and patent landscapes that define these technological trailblazers.
Jump to…
Global Footprint and Patent Coverage
Global Innovation 100: The Regional Landscape
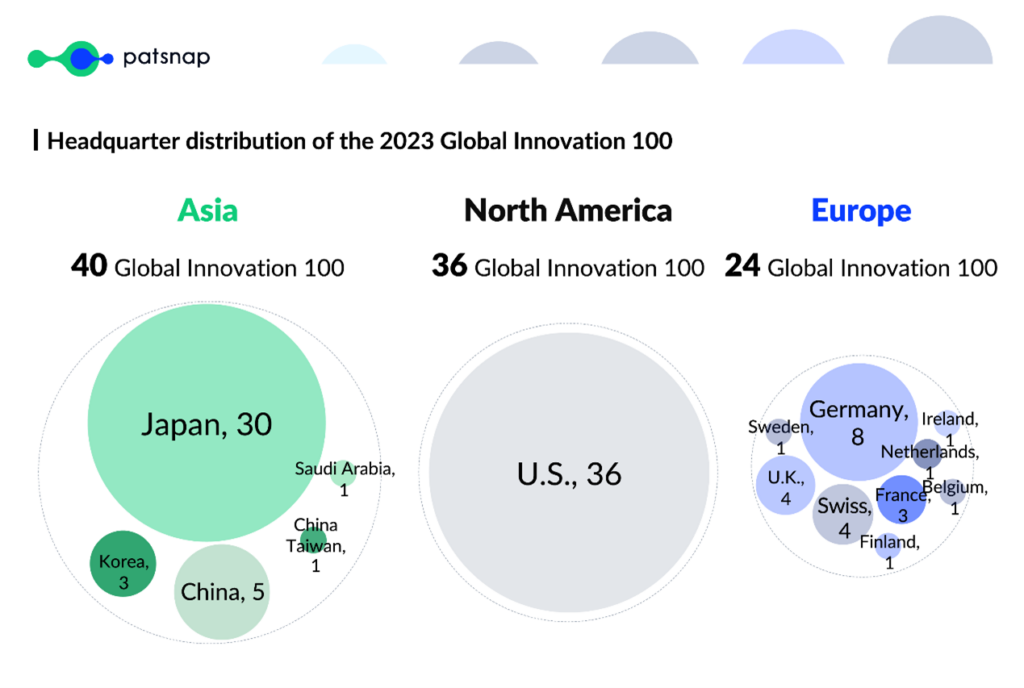
Hailing from 15 countries and spanning 11 diverse industries, the Global Innovation 100 showcase a remarkable global reach. With headquarters distributed across countries such as the U.S., Japan, Germany, China, Switzerland, and the United Kingdom, these innovators represent a diverse array of technological prowess.
Region-wise, the majority of the Global Innovation 100 are rooted in the U.S. and Japan, comprising nearly two-thirds of the list. On a continental level, Asia dominates with 40%, driven primarily by Japan. North America, entirely represented by the U.S., and Europe, with a balanced distribution across nine countries, follow closely.
Global Footprint and Patent Coverage:
Surprisingly, the Global Innovation 100 extend their reach far beyond their headquarters. With 68,000 “tech subsidiaries” operating globally, these companies have established a formidable presence in 181 countries, filing a staggering 20.8 million patent applications in over 159 countries.
Asia, North America, and Europe: A Comparative Analysis:
Diving into the characteristics of the Global Innovation 100, distinct trends emerge across Asia, North America, and Europe.
Asia’s Technological Dominance:
- Asia-based companies lead in Technology Size, boasting an average of 280,000 patent applications each, about 1.5 times that of Europe and twice that of North America.
- Top contributors include Panasonic, Samsung Electronics, and Hitachi, filing 1.06 million, 880,000, and 730,000 patents respectively.
North America’s Innovation Influence:
- North American companies excel in Technology Influence, with an average citation of 12.6 times per patent, more than double that that of the Global Innovation 100 from Europe and Asia.
- U.S.-based companies such as Medtronic, Oracle, and Boston Scientific lead the pack with patents cited 49 times, 30 times, and 30 times on average, respectively.
Europe’s Global Technological Reach:
- European companies exhibit a higher level of Technology Globalization, filing patents in an average of 101 countries, surpassing other continents.
- Notable contributors include AstraZeneca, Novartis, Bayer, Sanofi, BASF, and Shell, filing in over 120 countries.
Industries Driving Innovation:
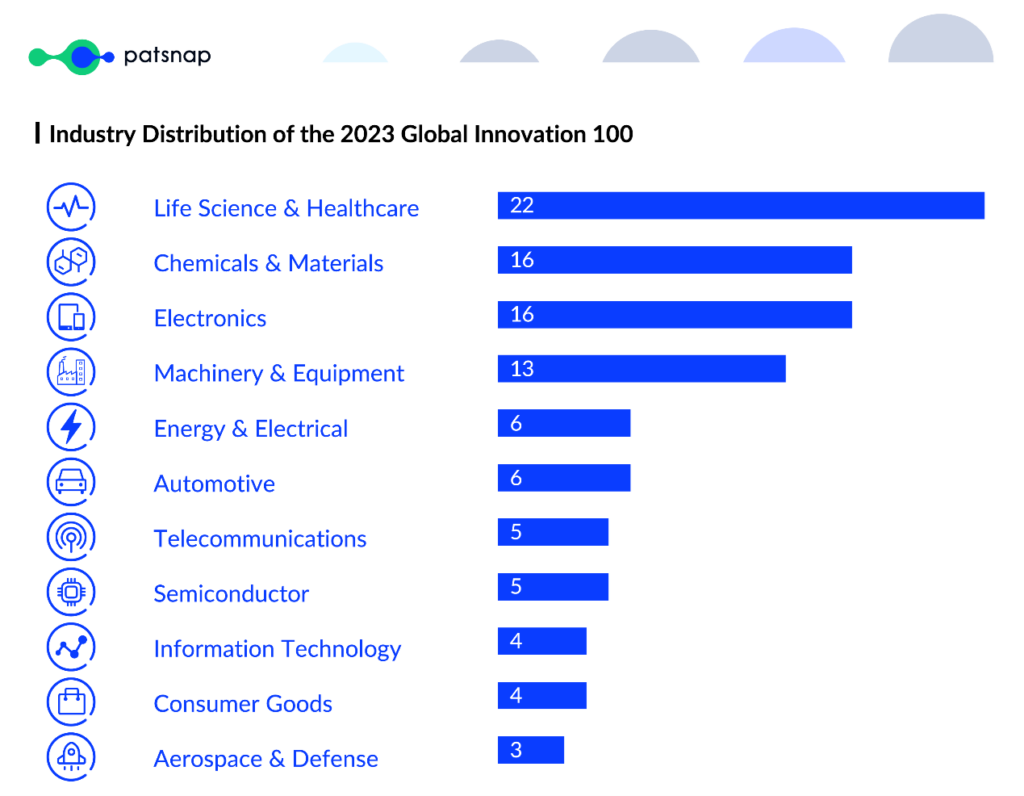
The Global Innovation 100 are spread across 11 industries, with Life Science & Healthcare, Chemicals & Materials, Electronics, and Machinery & Equipment taking the lead. Together, these four sectors account for nearly 70% of the innovators, showcasing a concentration of technological advancement in critical areas such as healthcare, materials, electronics, and machinery.
In conclusion, the Patsnap 2023 Global Innovation 100 emanate from diverse corners of the globe, driving technological progress and innovation in pivotal industries. For a comprehensive analysis and further insights, refer to our 2023 Global Innovation Report. Explore the trends, discover the innovators, and join us in celebrating the global spirit of innovation that defines the year 2023.
Your recommended content
-
All Charged Up: Power Batteries & The Patent Race Shaping the Future of Electric Mobility
Category: Article | Category: battery technology | Category: electric vehicle | Category: EV | Category: lithium ion | Category: lithium ion battery | Category: NEV | Category: new energy vehicles
Monday, April 22, 2024
In the ever-evolving landscape of innovation, the electric vehicle (EV) industry stands as a beacon of technological transformation. As we explore the patents propelling the EV revolution, Apple's venture serves as a poignant example of the challenges even industry giants face in this competitive arena. Join us on a journey through the global patent landscape, where the quest for superior power solutions unfolds, and where the true pioneers of the EV revolution are making their mark.
-

The People vs. AI: Who Owns Ideas in the Era of Generative Artificial Intelligence?
Category: AI era | Category: AI-driven creativity | Category: AI-generated creations | Category: Article | Category: copyright and patent rights | Category: digital innovation | Category: innovation | Category: intellectual property law | Category: legal implications | Category: OpenAI Sora | Category: patent law | Category: Research Tag | Category: Sora | Category: text-to-video generative AI | Category: who owns AI
Monday, April 22, 2024
OpenAI’s Sora software, a text-to-video generative AI model, recently made headlines showing a series of 1-paragraph prompts and some high-quality footage generated based on those prompts. It is a rightfully impressive showing, but it’s still too early to identify how IP law will be disrupted by generative AI. This editorial delves into the multifaceted landscape of Sora's impact, offering insights into the future of innovation and ownership in the AI era.
-

Patsnap Releases 2023 Global Innovation Report: The Brilliant Names to the Dynamic Landscape of Innovation
Category: Article | Category: eBook | Category: Research Tag | Category: Whitepaper
Wednesday, November 15, 2023
The Global Innovation 100 and Global Disruption 50 transcend individual entities, each representing a small innovation ecosystem with numerous subsidiaries. Through the innovation data of these companies, we gain insights into the characteristics, structures, and trends of global innovation.